TIKTOK · INSTAGRAM — DAILY SNAPSHOTS FROM DAY ZERO
Measure what you post. Understand what grows.
The TikTok and Instagram APIs only return the present. Reels Analytics stores a daily snapshot of every video and turns that history into decisions: which format performs, which day it took off, and what to compare yourself against.
A week or a month, at a glance
TikTok and Instagram summed into a single pulse, with the per-platform split always in sight.
Each one, on the day it landed
The delta is attributed to the day it happened, not the day the cron captured it.
Day 5 of the SoloQ Challenge and everyone's stuck
The panel flags only the one that beat its week: benchmarked against its cohort, not the whole catalog.
You'll find the whole life of every video: where it stood on day one, where it settled, and the moment it took off.
You'll find your video types side by side, ranked by views and engagement, so you know which one to repeat.
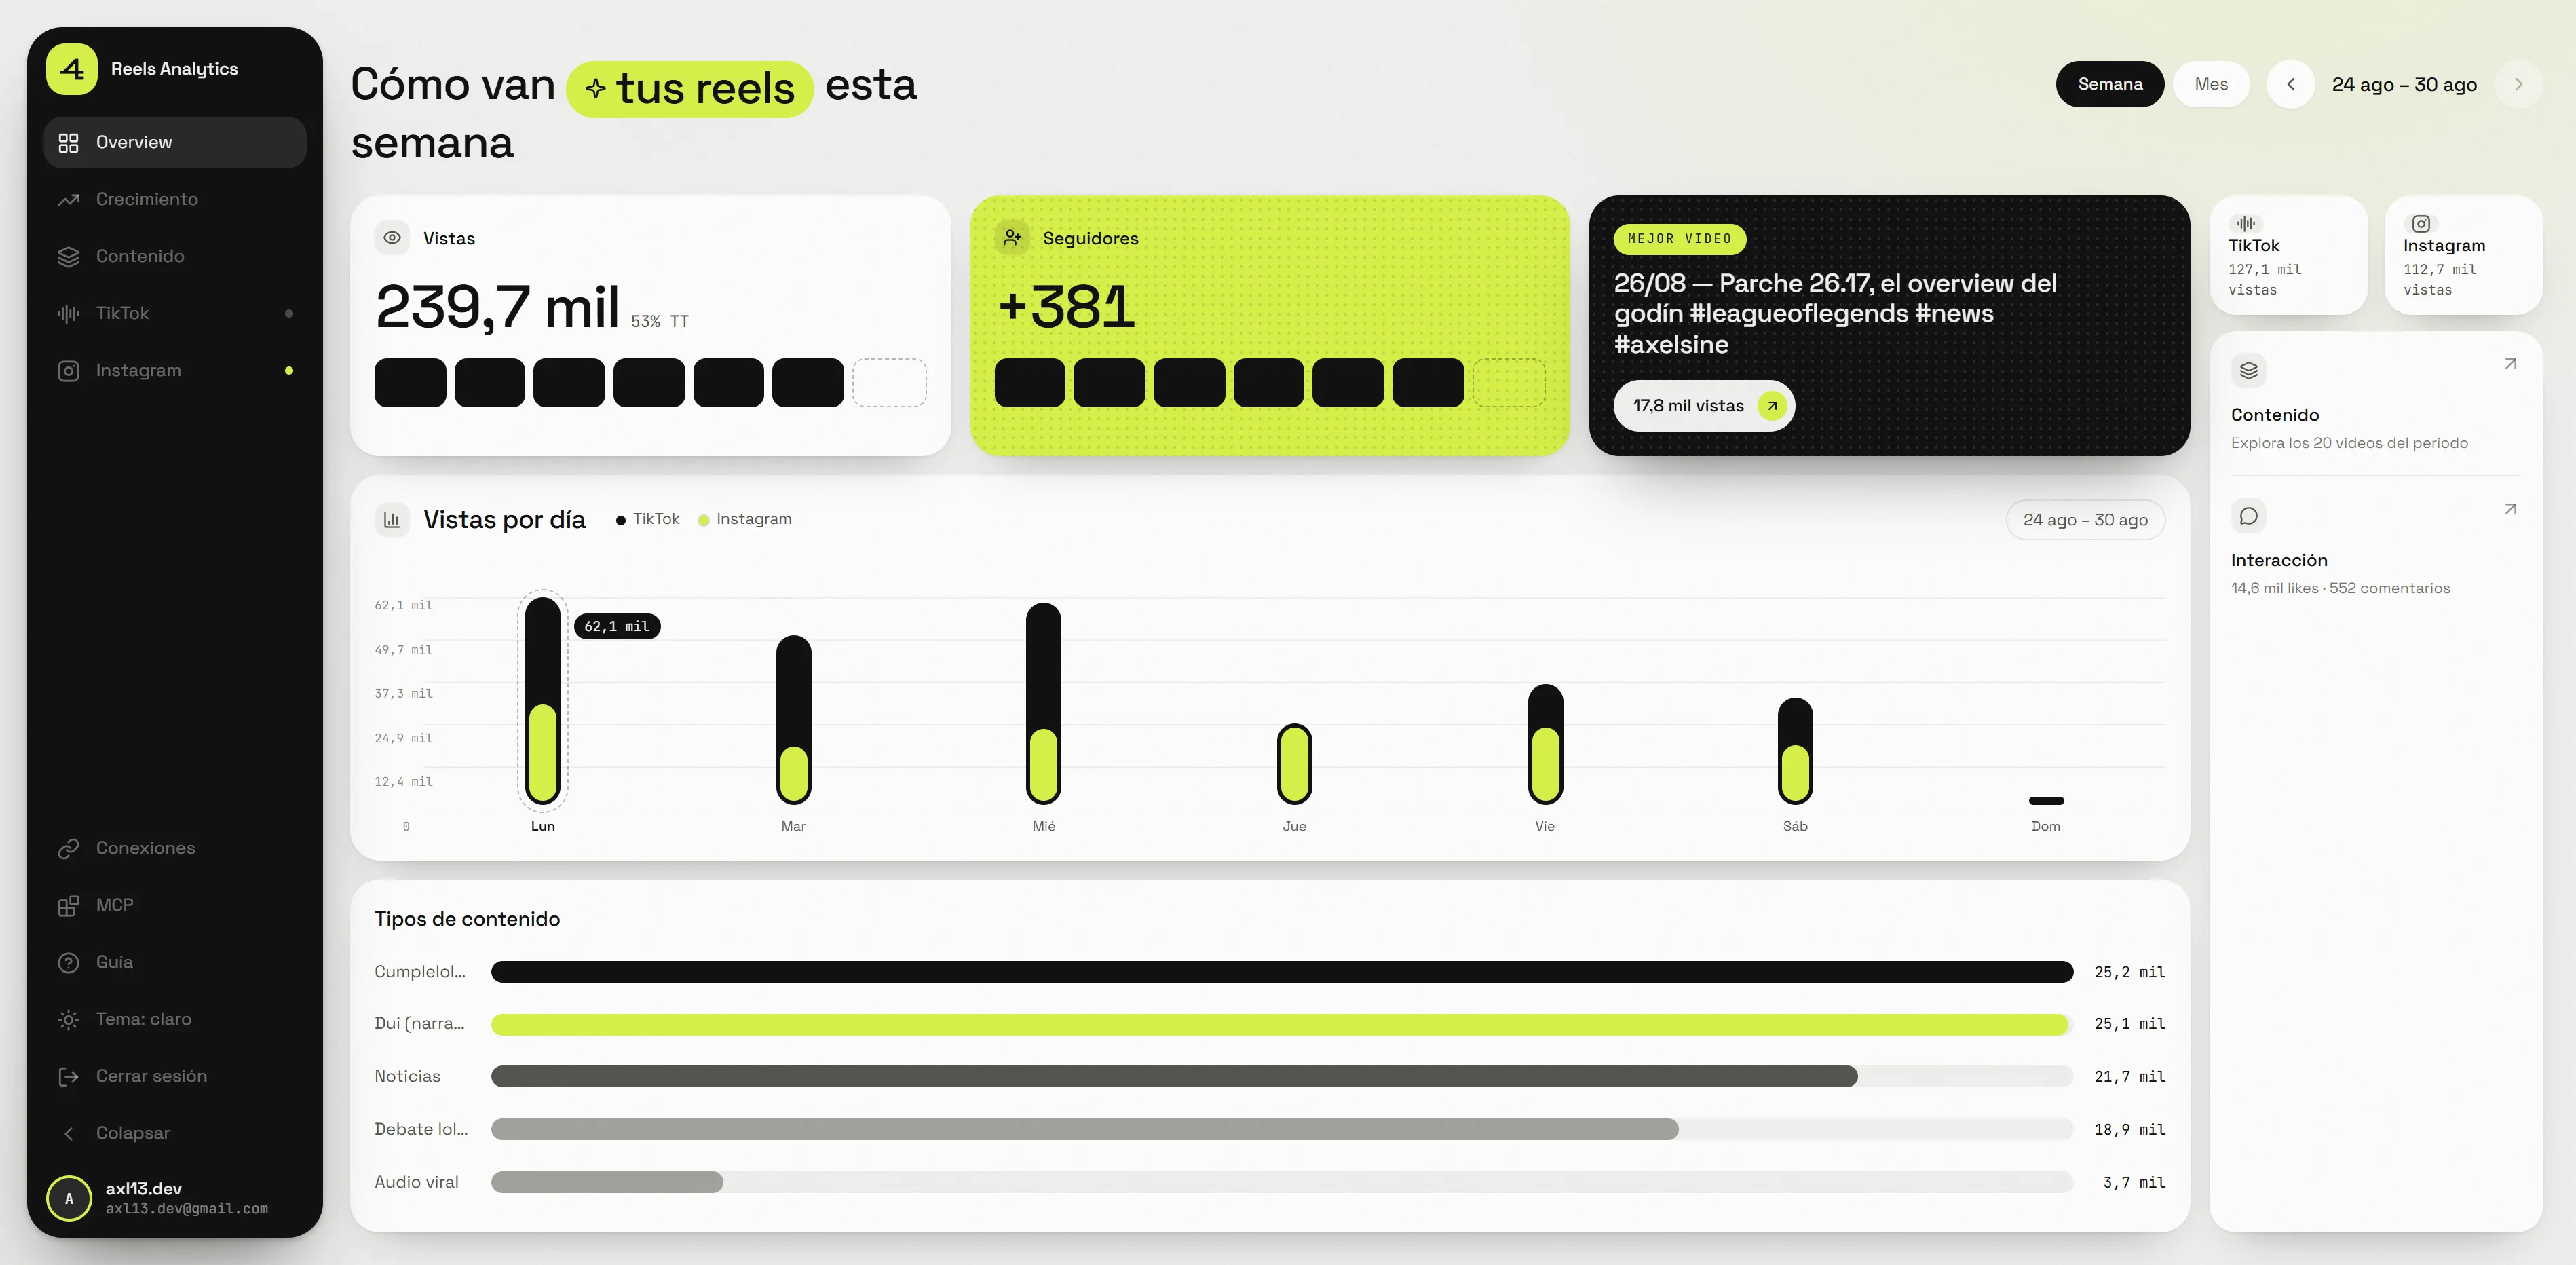
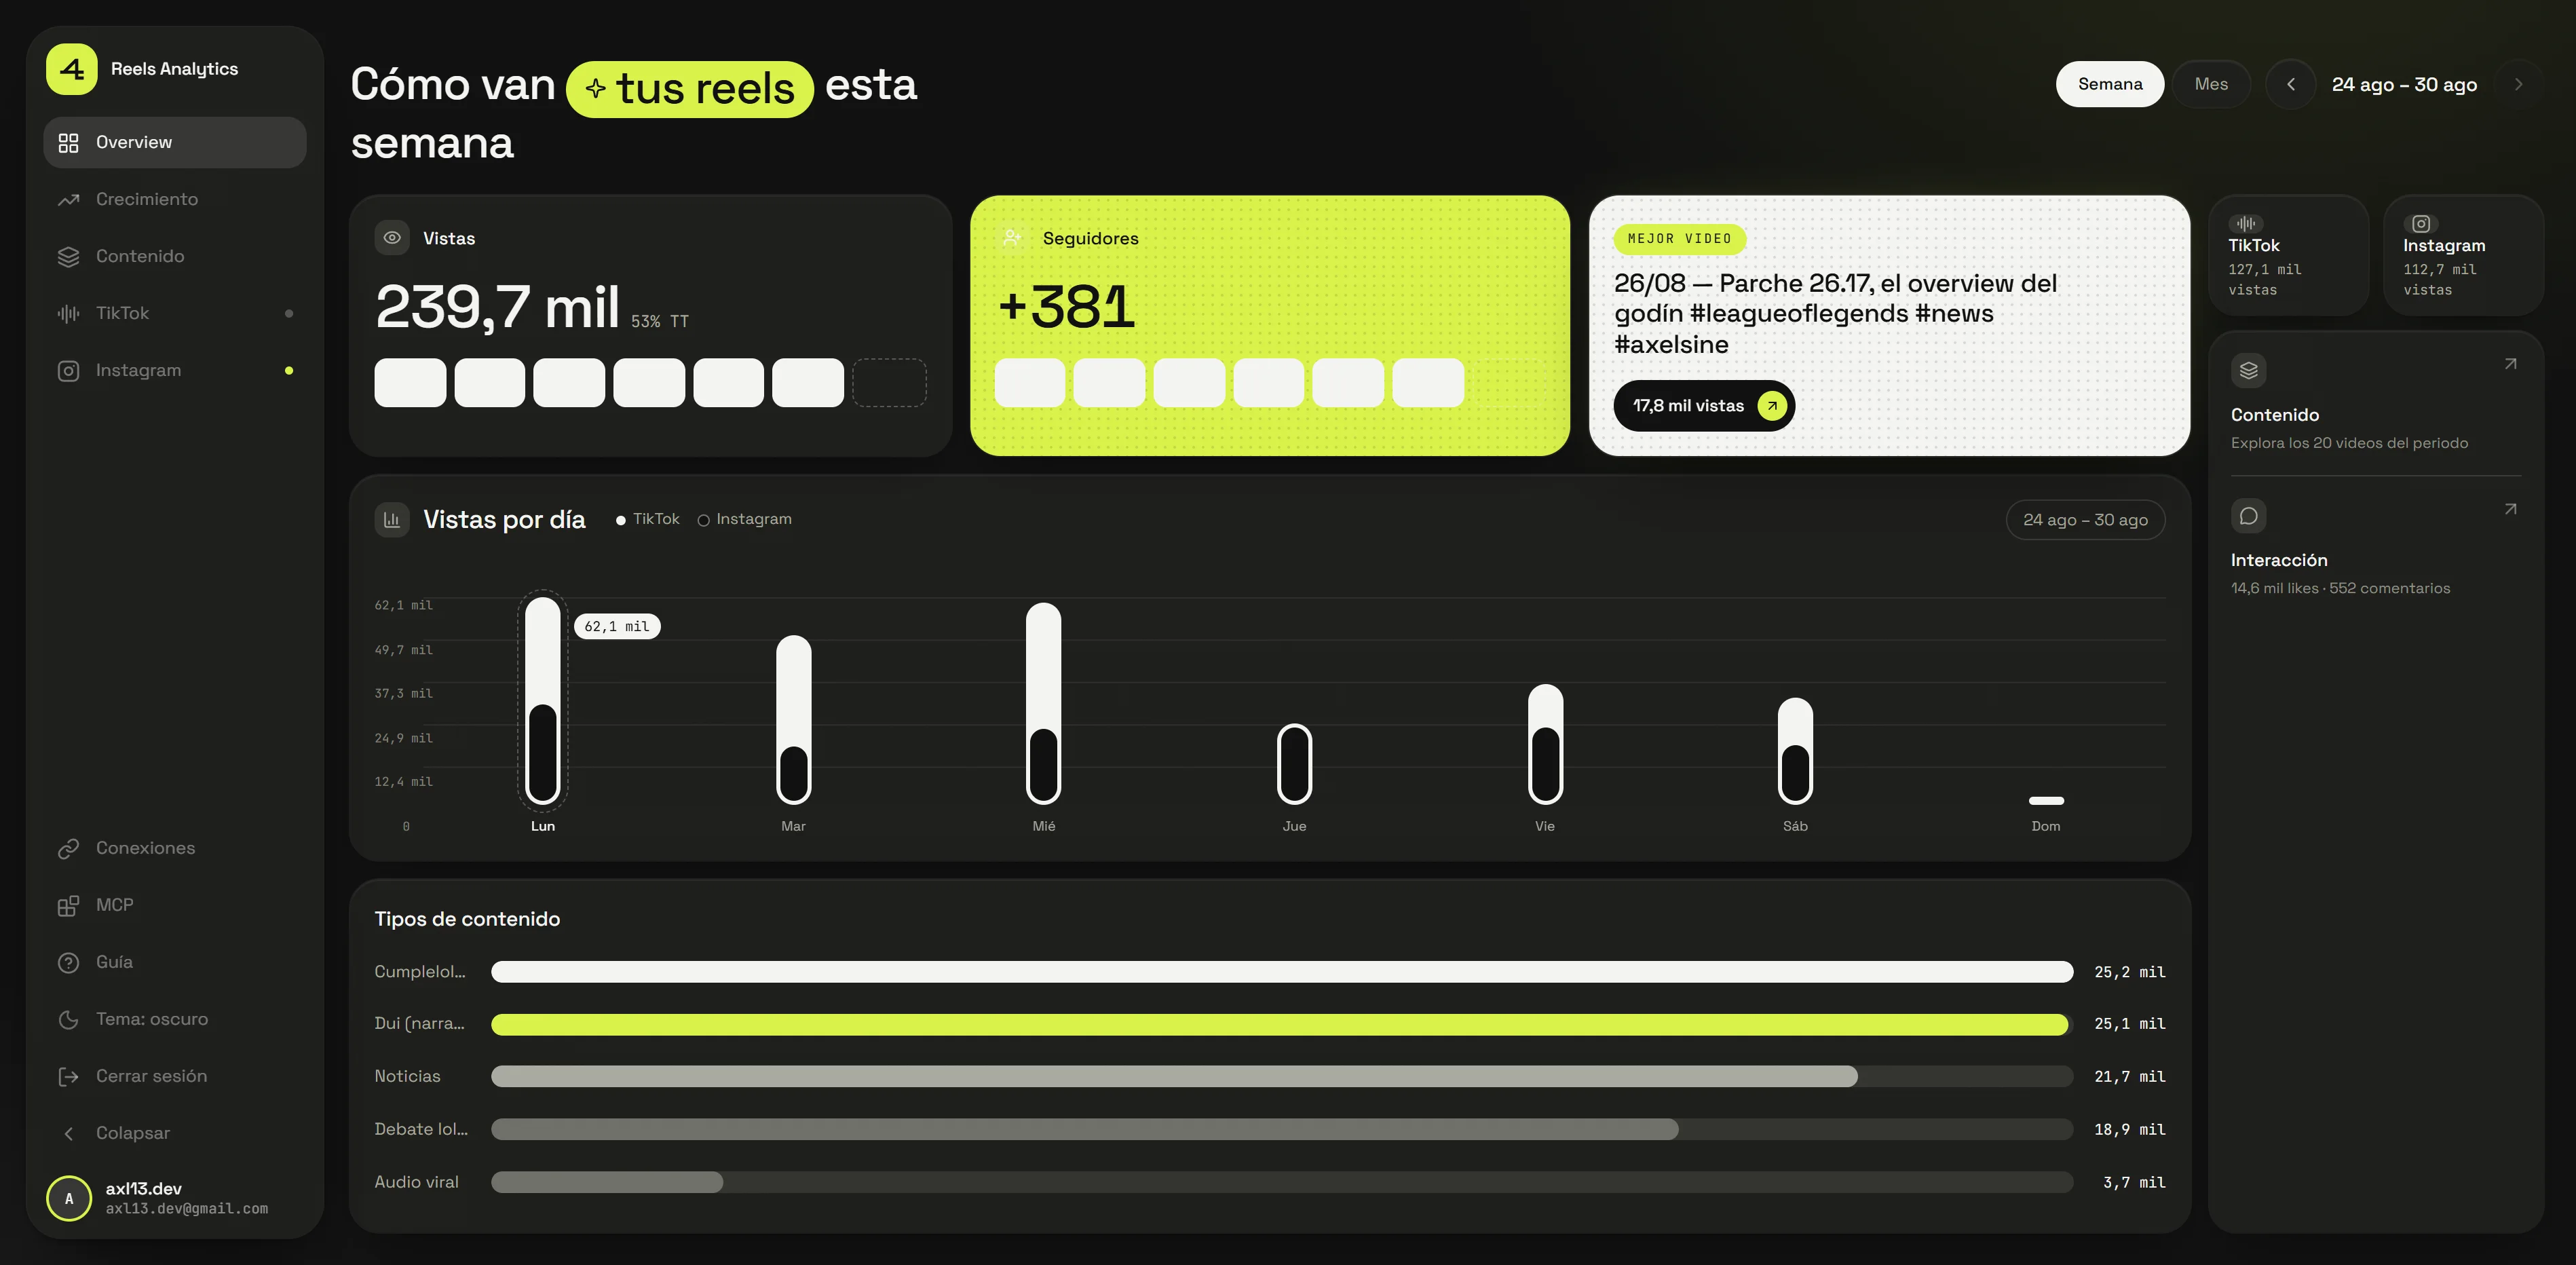
Every day, one more layer of history.
Snapshots stack up quietly, today on top of yesterday. By the time you need a video's curve, it has been writing itself for weeks.
Three steps, zero maintenance
Your history starts the day you start saving it.
SELF-HOSTED · NEXT.JS + SUPABASE · YOUR DATA IS YOURS